

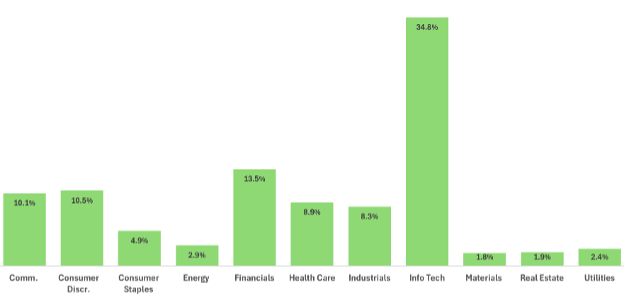
Most of us recognize the term “status quo” as referring to the current state of affairs — often stable, familiar and resistant to change. In the investment world, the status quo manifests through accepted norms and practices that insiders take for granted, even though they may seem opaque or unintuitive to those outside the industry. Consider, for instance, the two graphs below showing sector allocations across different indices. If asked, “Which graph best represents a market- or sector-neutral index?” how would you respond relative to a person with limited investment experience?
Graph A:
Graph B:
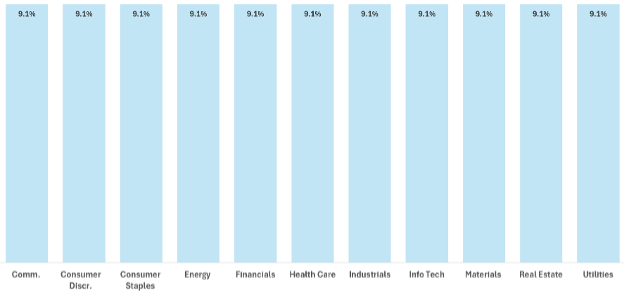
From a visual perspective, all the sectors within Graph B have an equal weight, so this may be the intuitive choice. However, in the investing world, market- or sector-neutral is defined in relative terms to a benchmark. Based on industry conventions, the correct answer would be Graph A, which represents the sector weights of SPY, an ETF that mirrors the S&P 500 Index. Graph B shows the eleven SPY sectors equally weighted. While Graph B is sector-neutral in absolute terms, it is not sector-neutral in relative terms.
Benchmarks Evolve
Benchmarks are part of the investment world’s status quo, often selected as a default decision with little thought. But benchmarks evolve over time based on market conditions and changes to the underlying constituents. Consider the Bloomberg U.S. Aggregate Bond Index over the past 20 years.
Duration, a measure of a bond’s sensitivity to interest rates, has ranged from 3.9 to 6.8 years, reflecting how issuers adjust maturities to optimize financing — borrowing long when rates are low, and short when rates are high. For investors, this swing represents an over 70% increase in the interest rate risk embedded in the index.
Treasury exposure has also grown significantly, rising from about 25% in 2006 to roughly 46% today as U.S. budget deficits have increased. Because the index is effectively market-cap weighted, the more debt an entity issues, and the more leveraged and likely less credit worthy the entity becomes, the larger its weight in the index.
Anchored Psychology
Anchoring to the benchmark can also shape investor psychology. Consider the S&P 500 and its impact on the investor psyche from the beginning of the century through today. From 2000 to 2009, the index saw two major drawdowns resulting in flat performance for the entire decade. This led to disillusionment, prompting shifts toward diversification, absolute return thinking and alternative benchmarks. Investors clung to pre-crash highs and misjudged recovery timelines. Institutional managers faced career risk for deviating from the index.
From 2010 onward, strong returns and tech-driven concentration reinforced the S&P’s dominance, fueling passive investing, FOMO and misaligned comparisons for portfolios with different objectives. Across both periods, the S&P served not just as a performance yardstick but as a powerful psychological anchor, shaping expectations, risk perception and portfolio behavior.
This psychological anchoring underscores the importance of choosing benchmarks deliberately, not just for performance comparison, but for aligning with investment philosophy and objectives. The CFA Institute outlines seven key criteria that define a suitable benchmark for evaluating investment performance, captured by the acronym SAMURAI. Benchmarks should be:
● Specified in advance: established before performance measurement begins
● Appropriate: aligned with the manager’s investment style, expertise or mandate
● Measurable: regularly and objectively calculable returns
● Unambiguous: clearly defined and transparent constituents and weights
● Reflective: accurately represents the manager’s current investment views and opportunity set
● Accountable: the manager can explain deviations from the benchmark
● Investable: capable of being replicated or directly invested in by an investor
It is important to distinguish between return objectives and benchmarks. A return objective of 5% over the consumer price index may align well with the goals of an endowment or an individual aiming to spend 5% of their portfolio annually while preserving future purchasing power by keeping pace with inflation. However, it fails several key benchmark criteria: It is not investable, deviations from it cannot be explained and it provides no insight into the risk required to achieve the target return.
Choose Benchmarks Thoughtfully
Benchmarks are essential tools for assessing performance, managing risk and shaping asset allocation strategies. Yet while they may seem objective or broadly representative, benchmarks can conceal structural risks – from the concentration of mega-cap tech in the S&P 500 to the growing dominance of Treasurys in the Bloomberg U.S. Aggregate Bond Index. That’s why it is crucial to choose benchmarks thoughtfully, ensuring a clear understanding of their underlying exposures and embedded risks and whether they truly align with long-term goals.
Paul Kenney is SVP, Client Solutions at financial data and technology company Syntax Data.


